
About the System
We receive a lot of questions from curious museum professionals, organizations considering joining COVES, and professionals interested in improving their evaluation skills and knowledge. Regardless of where your curiosity comes from, we’d love to fuel it! Here are our answers to a number of Frequently Asked Questions about the COVES initiative.
The Survey
What Is The Survey Like?
Here is a version of the standardized COVES survey that we use in the training process – it includes the questions and response options that all museums use, as well as a brief rationale for each. You’ll see that it’s not that revolutionary, but it ensures that museums are asking the exact same questions in the exact same way to enable comparison between sites. Click here to learn more about the COVES survey.
This is what we call our “core” survey, because it is the base for all COVES institutional surveys. That said, each museum is able to tailor specific aspects of the survey, adding some questions that are of specific interest. Some Participating Sites ask about marketing, some ask about educational initiatives – the focus is up to you. Of course, we’ll help think through each question you want to add to ensure the data you gather meets your needs.
How Many Surveys Do We Need To Collect? How Do You Decide On The Sample Size?
The sample size, the number of completed surveys each museum should try to gather each month, is based on a museum’s general visitor audience size. We look at your visitor patterns for the last two years, and we figure out (1) how many completed surveys you will seek to gather in a year, and (2) how many surveys you should try to collect each month. For example, if your museum sees about 250K visitors a year, you would look to collect about 800 surveys per year, and those 800 surveys would be distributed across the 12 months of the year in proportion your visitor patterns each month (as in, you’d collect more surveys in July than September).
When Are We Done Collecting Surveys? How Many Days A Year Do We Need Data Collectors?
We hope NEVER! The “O” in COVES literally stands for “Ongoing,” so the data collection process occurs across the year.
Throughout the year, your data collectors will be handing out only one survey, but the information you collect through that survey will change over time as your museum offerings change. On average, museums spend 200 hours a year, collecting data. This time is best broken up into 2-4 hour segments.
Data Collection
How Do We Collect The Data?
We will go through this in GREAT (too great? no, never) detail during the half-day training. The survey is completed on-site by visitors right before they leave your site. The data collector is stationed near the exit and requests visitors to complete the 7 minute survey on a tablet or computer. The data collector will either hand over the tablet to the agreeable visitor or make a note in a “Refusal Log” that is also loaded on the device.
What If We Don’t Have Consistent, Or Any, Wi-Fi In Our Visitor Spaces?
We know that not all museums have strong internet signals across their campus. If you have a weak signal near your exit, we suggest having the data collector carry a Hot Spot with them during data collection. Paying a modest monthly rate is much more economical than boosting the signal by updating or installing a wireless signal!
Where Does The Data Go? Who Does What For Data Cleaning, Storage, And Analysis?
All of the data is stored online, in a secure account within Qualtrics, which only the COVES research team has access to. Each month, Alex and Ryan download the completed surveys, clean the data and make sure everything is appropriately arranged for inclusion in the COVES dashboard, and upload each museum’s proprietary data to their dashboard. An aggregate set of data is also uploaded, so we can all compare our visitors’ responses with each other, but no one but the research team and the data recipient at each site gets to the the original data files.
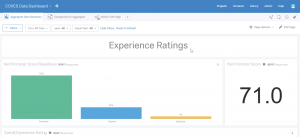
What Is The Online Dashboard?
One of the most informative and beneficial aspects of being part of the COVES initiative is the ability to track your museum’s visitor feedback each month, compare it over time, AND compare it with other COVES members! All of this day to day comparison is accomplished through the online dashboard that each COVES museum receives as part of the COVES system. The dashboard is exactly what you think it will be – a series of charts and graphs that show the responses to your survey!
 The online dashboard is available to museums once there are a sufficient number of completed surveys (usually 3 months) for the charts and graphs to show how people are experiencing your museum. Watch this video and take a virtual tour of the dashboard with Alex!